S1 - Sales YTD (IC45)
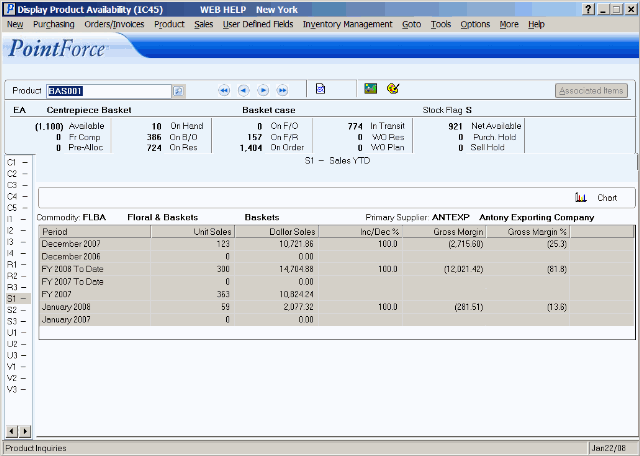
The S1 - Sales YTD folder displays Year-to-Date sales figures for the Product selected in the Header section.
- The S1 folder automatically displays Sales related information for the current Product. There are 5 fields listed above the list box:
- Commodity - the code used made up of the Product Line and Product Group assigned to the Product in Maintain Inventory Master (IM13). The Product Line and Product Group descriptions display automatically.
- Primary Supplier and Supplier Name
- Commodity - the code used made up of the Product Line and Product Group assigned to the Product in Maintain Inventory Master (IM13). The Product Line and Product Group descriptions display automatically.
- The list box automatically displays Sales statistics for the current Product. The following list defines each column in the list box:
- Period - the following Periods display:
- Month to Date - This Year (current month open)
- Same Month - Last Year
- To Date - This Year
- To Date - Last Year
- Total - Last Year End
- Month to Date - This Year (next month)
- Same Month - Last Year
- Unit Sales - for each Period.
- Dollar Sales - for each Period.
- Inc/Dec % - Increase or Decrease Percent is calculated as:
(This Year - Last Year * 100) / Last Year
- Gross Margin - the Gross Margin is calculated as:
Sales (dollar value) - Cost
Where Cost is calculated as the Sales less the Profit (dollar value) from Print Product Sales Reports (SA82).
- Gross Margin % - the Gross Margin Percent is calculated as:
(Sales - Cost) * 100 / Sales
- Period - the following Periods display:
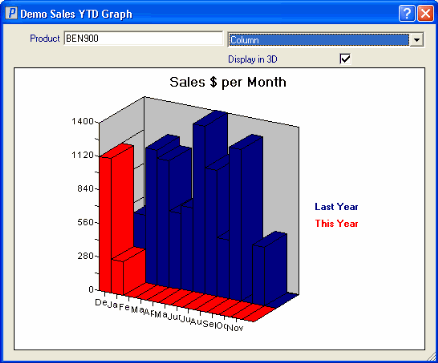
- To view this information in a chart, click on Chart above the list box.
- The Demo Sales YTD Graph screen opens. Using the dropdown list, you can select different methods from which to view the chart. You can also select the option to display the chart in 3D format.

Folder S1 - Sales YTD

