S1 - Sales YTD (IC45)
Folder S1 - Sales YTD
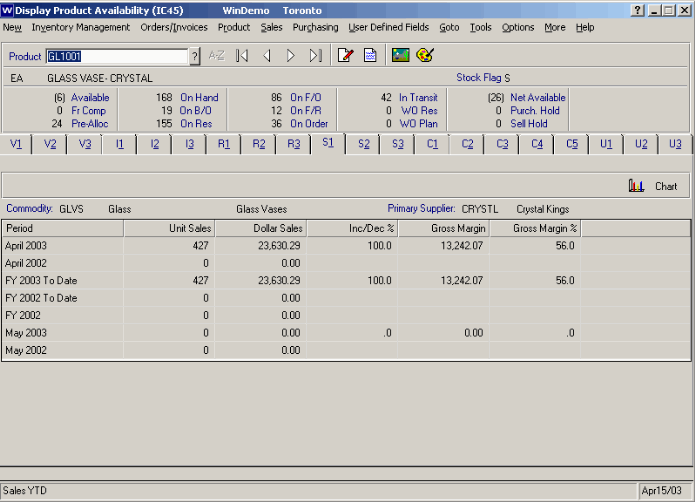
By product, this folder displays Unit Sales, Dollar Sales, Increase/Decrease %, Gross Margin and Gross Margin % compared to last year for the following time frames:- Month to Date - This Year (current month open)
- Same Month - Last Year
- To Date - This Year
- To Date - Last Year
- Total - Last Year End
- Month to Date - This Year (next month)
- Same Month - Last Year

Folder S1 - Sales YTD
Chart 
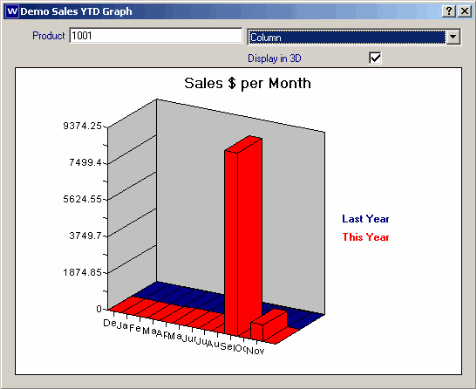
The information provided can be displayed in various chart formats for example bar, column, ribbon, pie. Click the Chart Icon if you want to see the information displayed as a chart, then select what type of chart you would like from the pull down menu. You can also choose to display the chart in 3D or not to display it in 3D by selection the check box provided in the pop up panel.

Sales YTD Chart
