Automated Purchasing Process
Forecasting
Forecasted Usage, usually shortened to ‘Forecast’, is the expected unit demand for a given Product within a 30 day (one month) period. The forecast is typically calculated by processing a Product’s demand through the Forecast Calculation table when Forecast/Purch/Lead-Time Recalc (PO25) is executed. It may optionally be set manually in Maintain Inventory Masters(IM13/Warehouse). In either case, the Forecast is stored in the ‘Monthly Forecast’ field in IM13/Warehouse.
The value stored on the Inventory Master record represents a forecast for a period’s worth of usage. Regardless o f the period ending dates in Maintain Fiscal Dates (CC90), the calculations performed by PO25 treat each period as though it has 30 days of activity. In formulas describing the calculation of Purchasing Criteria, however, the term Forecast is used to represent the daily usage; essentially Forecast divided by 30 days yields an estimated daily usage.
The Forecast Calculation Code (PO07) maintains information required in order to determine a Forecast, and therefore, the inventory requirements for the upcoming period. The table is used by the recalculate forecast program (PO25) to calculate what the forecasted (future) demand of a Product will be for a reorder period based on the Product’s past demand statistics.
One of the best tools for looking at demand for a Product is Display Product Availability (IC45/C2 Demand Information). This panel displays the 24 months of history for the Product entered in the Header section:
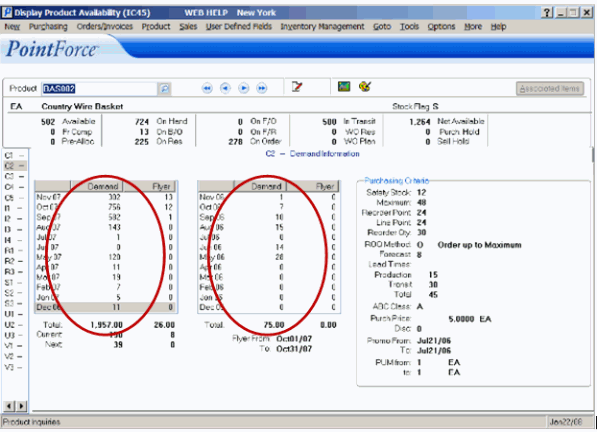
IC45/C2 Demand Information
This demand information is used when determining the weighted forecast for the Product in Maintain Forecast Calc. Code (PO07). Forecast Calculation Codes are defined in PO07 and are assigned to Products in IM13.
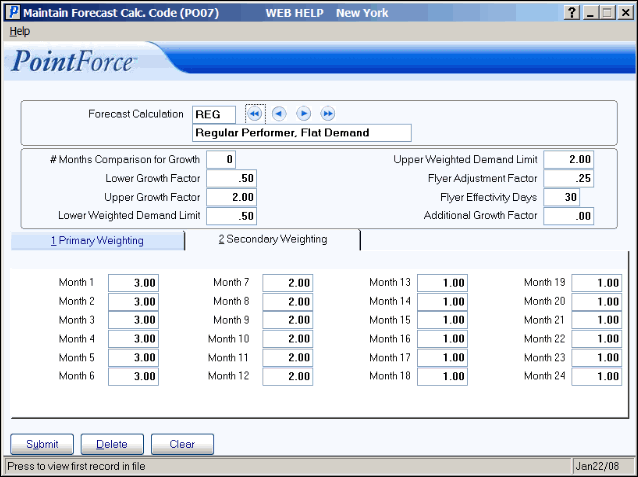
Maintain Forecast Calc Code (PO07)
On the Primary Weighting folder, the weightings or relative ratios are listed. These ratios allow you to specify the importance of each month’s historical demand. The weightings are relative, i.e. using the example listed above, one can achieve the same results by using half the amounts. For example:

The results in red produce the same results as the original value in the table. The key is you are creating a relative weighting or ratio for the forecast calculation code.
- A second set of weightings or relative ratios can be listed on the Secondary Weighting folder. This folder is used in cases where the demand data for a product is inconsistent on a month-to-month basis, as in the case of a seasonal product. Demand may spike for a short period of time, for example for 2 to 3 months. The primary weightings in this case may focus on one or two months. When this narrow band hits lower demand months, the forecast might not be deemed ‘reasonable’. The secondary weighting folder can be set up to examine a larger window of time, for example 3 or 4 months. This ‘smooths out’ the forecast, especially in the months just before and just after the demand spike.
The Weighted forecast is determined by Forecast/Purch/Leadtime Recalc (PO25). Specifically, the PO25 calculation is:
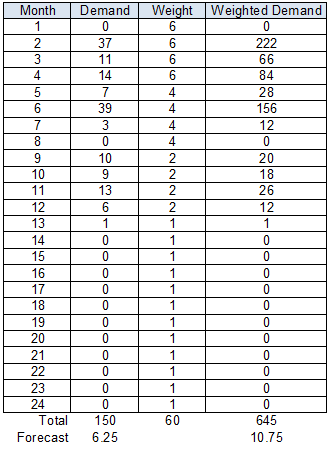
This chart demonstrates that the Demand for the most recent period in IC45/C2 is multiplied by the primary weighting for month 1 in PO07 for the Forecast Calculation Code assigned to the Product. PO25 performs this same calculation for all of the previous months. In this example, all 24-months are examined by PO25.
Demand X Weight = Weighted Demand
PO25 adds every line from Month 1 to 24. Following our example, the total is 645. This TOTAL is then divided by the sum of all of the weightings entered in PO07 for the Forecast Calculation Code. In the case of REG, the sum of all weightings is 60. The Weighted Forecast for REG for ACC351 Product is:
645 divided by 60 = 10.75
PO25 then performs a reasonability test using the ‘Upper Weighted Demand Limit’ and the ‘Lower Weighted Demand Limit’ values entered in PO07. The Weighted demand is compared to the simple demand (simple demand = a weighting of 1.00). If this ratio falls between the ‘Upper Weighted Demand Limit’ and the ‘Lower Weighted Demand Limit’ then the Primary Weighting is used. However, if the ratio falls above or below the Limits entered in PO07, then the system goes to the Secondary Weighting values set in PO07/Secondary Weighting folder. If the secondary weighting comparison also fails to fall within the Upper and Lower limits from PO07, then the system uses the ‘simple’ weighting. Following our example:
‘Simple’ Weight Total 150 divided by 24 = 6.25
Ratio of Primary Weighting to Simple Weighting is: 10.75/6.25 = 1.72
And the result of the comparison is 1.72 which falls between the Lower Weighted Demand Limit of 0.50 and the Upper Weighted Demand Limit of 2.00 (set in PO07). In this example, the Primary Weighting passes the reasonability test and will be used by PO25.
If you would like more information on the relationship between demand in IC45/C2 and the weightings defined in PO07, click here.
Note: The ‘limits’ (Upper and Lower Weighted Demand limits) applied to Seasonal forecasts can be much higher and much lower when compared to the same limits for a Regular forecasts (with flat demand).
- In the REG Forecast Calc. Code, the Upper Weighted Demand Limit is set to 2.00, while a Seasonal Forecast Calc. Code can have the same limit set as high as 9.99.
- In the REG Forecast Calc. Code, the Lower Weighted Demand Limit is set to 0.50, while a Seasonal Forecast Calc. Code can have the same limit set as low as 0.01.
Normalizing Flyer Demand
In the demand information provided by IC45/C2 for each Product, Flyer demand is also tracked. If the reorder period being forecast does not include a flyer, then any period in the booking history that has flyer units will be reduced to normalize the demand. Similarly, if the reorder period being forecast includes a flyer, then any period in the booking history that does not have flyer units will be increased to normalize the demand in order to get a more accurate forecast.
The PO25 recalculation routine uses the ‘Flyer Effective Days’ field in PO07 as the basis for the number of days in the future it looks for a flyer. If 30 is entered in this field, then the system checks for 30 days in the future to see if a flyer is being offered. If a Flyer was offered last year, and there is no effective Flyer for the same period this year, then the system uses the value in the ‘Flyer Adjustment Factor’ field in PO07 to adjust the demand. If 0.25 is the Flyer Adjustment Factor, then the system adjusts the demand from last year down by 25%. Conversely, if there is a flyer offered in the current year but no flyer was offered in the same period from the previous period, the demand is increased by 25%.
Let’s take a detailed look at Flyer demand. The first period includes a flyer, so each period in the 24-month booking history is examined for the presence or absence of flyer units booked. Each period that has no flyer units booked must now be “normalized” to simulate a flyer condition. Multiplying the total units booked for the period by the Flyer Adjustment Factor does this. Here is how the previous 24 Months’ demand looks:
Note: If the ‘Flyer Adjustment Factor’ is set to 0.00, the flyer files will not be read to determine flyer activity and no adjustment will be made to the booking history.
If the ‘Flyer Effectivity Days’ field is set to 0.00, the flyer files will not be checked at all and booking history will not be adjusted.
Taking Growth into Consideration
The system provides a tool to extrapolate year-over-year growth. This can be useful where there is an established pattern of annual growth (or reduction). By taking growth into consideration, the calculated forecast will be modified to extrapolate the change between recent demand and that of the prior year. Growth can be an increase in demand, and it can also be a decrease in demand for Products that are being replaced or phased out.
The recalculation routine (PO25) compares the past demand statistics in order to calculate a growth factor. The growth factor indicates whether this Product is increasing or decreasing in demand, and offers the operator the ability to apply some reasonableness checks. If the calculated growth factor is too high, or too low when compared to historical numbers, the forecast can be adjusted to limit the effects of this ‘peak’ or ‘valley’ in the data. The resultant growth factor is applied to the usage forecast (after normalization and weighting).
A growth factor is calculated by using the following formula:
The ‘# Months Comparison for Growth’ field in PO07 is used to determine the comparison timeframe for the calculation of a growth factor. Entering a value of 12 in this field causes the system to compare all twelve months this year to the twelve months of last year; entering a value of 6 in this field compares the most recent past six months of demand to the corresponding six months of the previous year. Entering a value of 0 in this field means that a growth factor will not be calculated. Similarly, if a Product does not have sufficient history, a growth factor will not be calculated (until enough months of demand have accumulated in order to invoke the calculation).
Note: The system retains 24 months of demand history. The most recent history is always compared to the previous history for the corresponding months in order to calculate a growth factor.
The Growth Factor is given a reasonability test using the ‘Lower Growth Factor’ and the ‘Upper Growth Factor’ fields. If the ratio of Recent Demand to Historical Demand falls within these limits, then the Growth Factor is considered to be reasonable. If it does not fall within these limits, then the Product is experiencing rapid growth or decline that is deemed to be ‘unreasonable’ and requiring limitation.
The following two examples illustrate how Upper Growth Factors can limit the effects that rapid growth has on inventory levels:
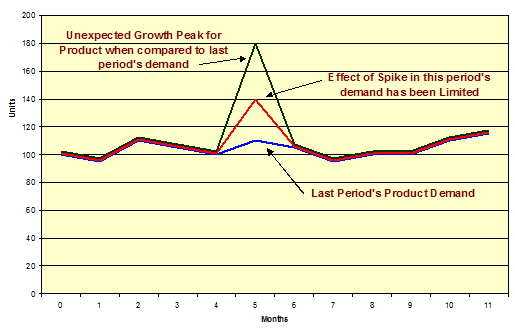
The following chart shows the annual demand for a typical Product. The large spike in the centre of the chart for this example can skew the average demand for this Product over time if left unchecked. By utilizing the Upper Growth Factor limit, the system ‘smooths’ the peak so that its effect on the average demand is lessened. The net effect is for the forecast to rise, but not as severely as is expected without the moderating influence.
This technique is useful for moderating the effects of one-time Customer purchases, unexpected ‘runs’ on Products for short periods of time, and other instances where demand may peak briefly then return to a more normal level.
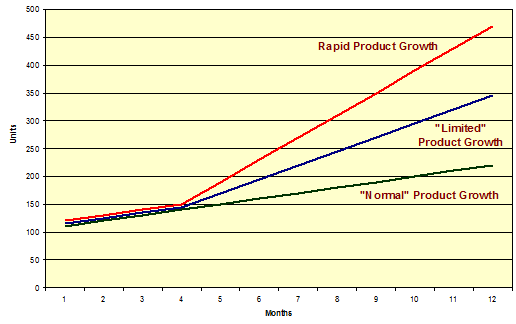
The following chart shows the effect that a continuous use of limiting growth factors will have on inventory levels. Where a rapid increase in Product demand causes more inventory to be purchased, a limited growth moderates the overall effect on inventory levels.
Caution: A moderating influence might result in a ‘too-sluggish’ response to dramatic changes in the marketplace.
The effects of limiting Product that is decreasing in demand can be considered by inverting these charts such that the indicators for rapid growth become those for rapid decline.
Planning for Additional Growth
The ‘Additional Growth Factor’ field represents a user-specified additional (i.e. future) growth rate to be applied to the forecast calculation. Entering zero in this field skips the calculation. The weighted demand is multiplied by the value stored in this field. For example, if the Additional Growth Factor is 1.25, then the weighted usage value is increased by an additional 25%.
Additional Growth can be used to massage the forecasted usage when known influences, not reflected in history, affect the bookings. These influences may be market oriented or may be business driven.
If an “Additional Growth Factor” is implemented, it is usually done at a specific time for a specific reason. As such, you should review the results periodically. When the growth factor is initially set up, it should accomplish what we immediately wish the effect to be (i.e. raise usage by 25%).
For more information on the Automated Purchasing Process, please see the following topics:

Growth Factor = Recent Demand (for # months specified) / Prior Year
Historical Demand (for # months specified)
For example, we use a Forecast Calculation Code that uses only the last 3 periods as the primary weighting. We know that a specific Product will likely drop in bookings by 30% as a result of a new release of a competitive Product. We set up our Product with a Forecast Calculation code that includes a growth factor of 0.7. After the first period, we have a period of booking history that reflects a timeframe when the “competitor” was out there. This history is one of the three months we are weighting and therefore our resulting weighted average includes the declining demand, the other two periods do not. Therefore we should consider changing the factor to possible 0.8 for the next period and to 0.9 for the period after that. At the end of the 3 periods, we can turn the growth factor off as all 3 periods being weighted in our calculation were at a time when the competitive Product was released. The system continues to possibly force a downward growth automatically as it compares recent booking to those of a year ago.
